Module 6.4: Collecting and using indicators
Collecting and using indicators
In this module, you’ll explore how to use indicators to track what’s changing and why it matters. Whether you're measuring attendance or shifts in confidence, the right indicators help you understand what’s working, where to improve, and how to tell the story of your project’s impact, both clearly and confidently.
This module will explore:
- What indicators are and why they matter
- How to choose indicators that match your outcomes
- Tips for collecting useful, meaningful data
- What standard indicators the Heart Foundation expects you to report on
Learning outcome:
By the end of this lesson, you’ll be able to select and apply indicators that make sense for your project and help you tell a clear, compelling story of impact.
Introduction video
Collecting and using indicators to tell your story
You’ve got a great program, but how can you show its true impact? That’s where indicators come in. Indicators are the measurable pieces of information that tell you whether your project is on track, where it’s making a difference, and how you can improve.
What are indicators and why you should care?
Let’s say you’re running a weekly community fitness class for people with disabilities. It’s going well, people are showing up, having fun, and moving more. But how do you prove this to a funder, to your community, or even to yourself?
That’s what indicators help you do. They’re like the speedometer in your car. They don’t drive the car, but they show how fast you’re going, whether you need to slow down, or if you're heading in the right direction.
Indicators are:
- Measurable pieces of information
- Based on your program’s goals and logic model
- Designed to track change over time
Indicators answer questions like:
- How many participants attended?
- Did people feel more confident and active?
- Are people likely to stay active after the program ends?
- Is the program improving wellbeing?
Without indicators, it’s hard to know what’s working. With them, you can show impact, improve delivery, and make better decisions.
SMART Indicators
A good indicator is like a good map - clear, precise, and helps you find your way.
For indicators to be useful, they should be SMART:
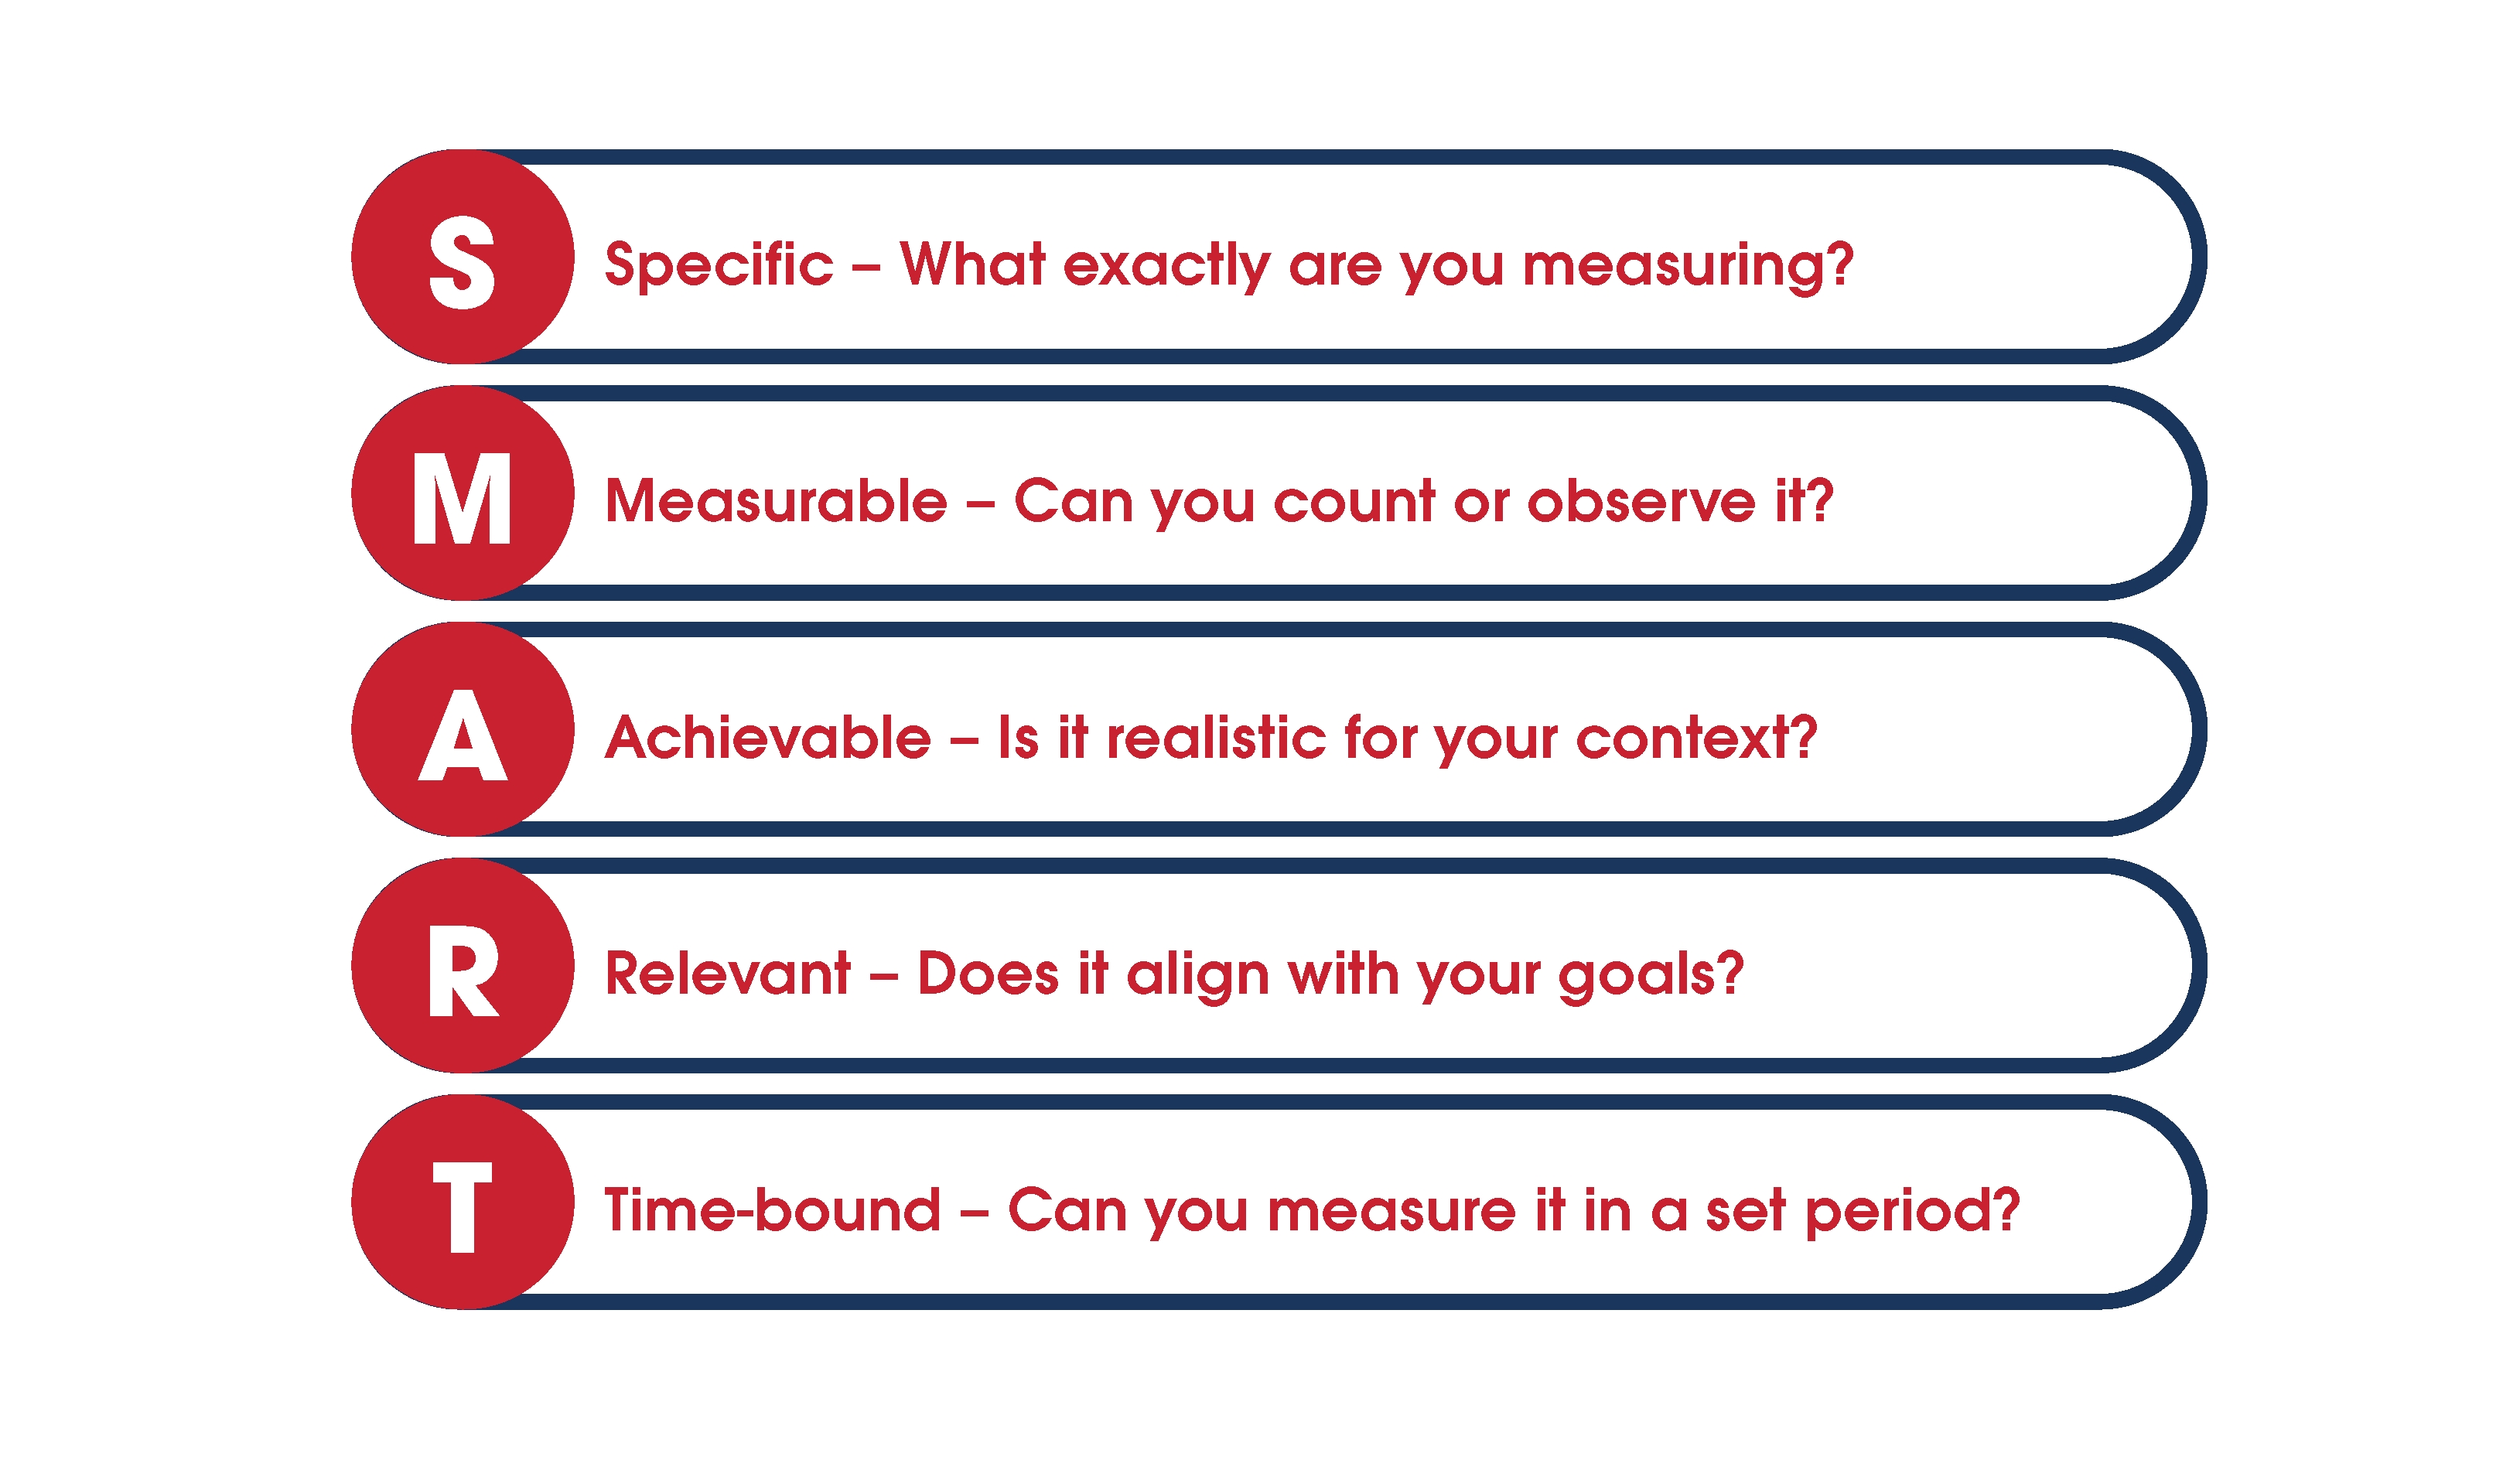
For example, rather than saying “participants felt better,” a SMART indicator might be:
“70% of participants reported improved mental wellbeing by the end of the 12-week program.” We’ve already thought about SMART goals in Module 4, so feel free to go back to help you think about if they are the right indicators for your program.
Linking indicators to your logic model
We can align our indicators to our logic model to build a good picture of your program. If you’ve worked through the earlier lesson on logic models, you’ll remember that we break a project down into five parts:
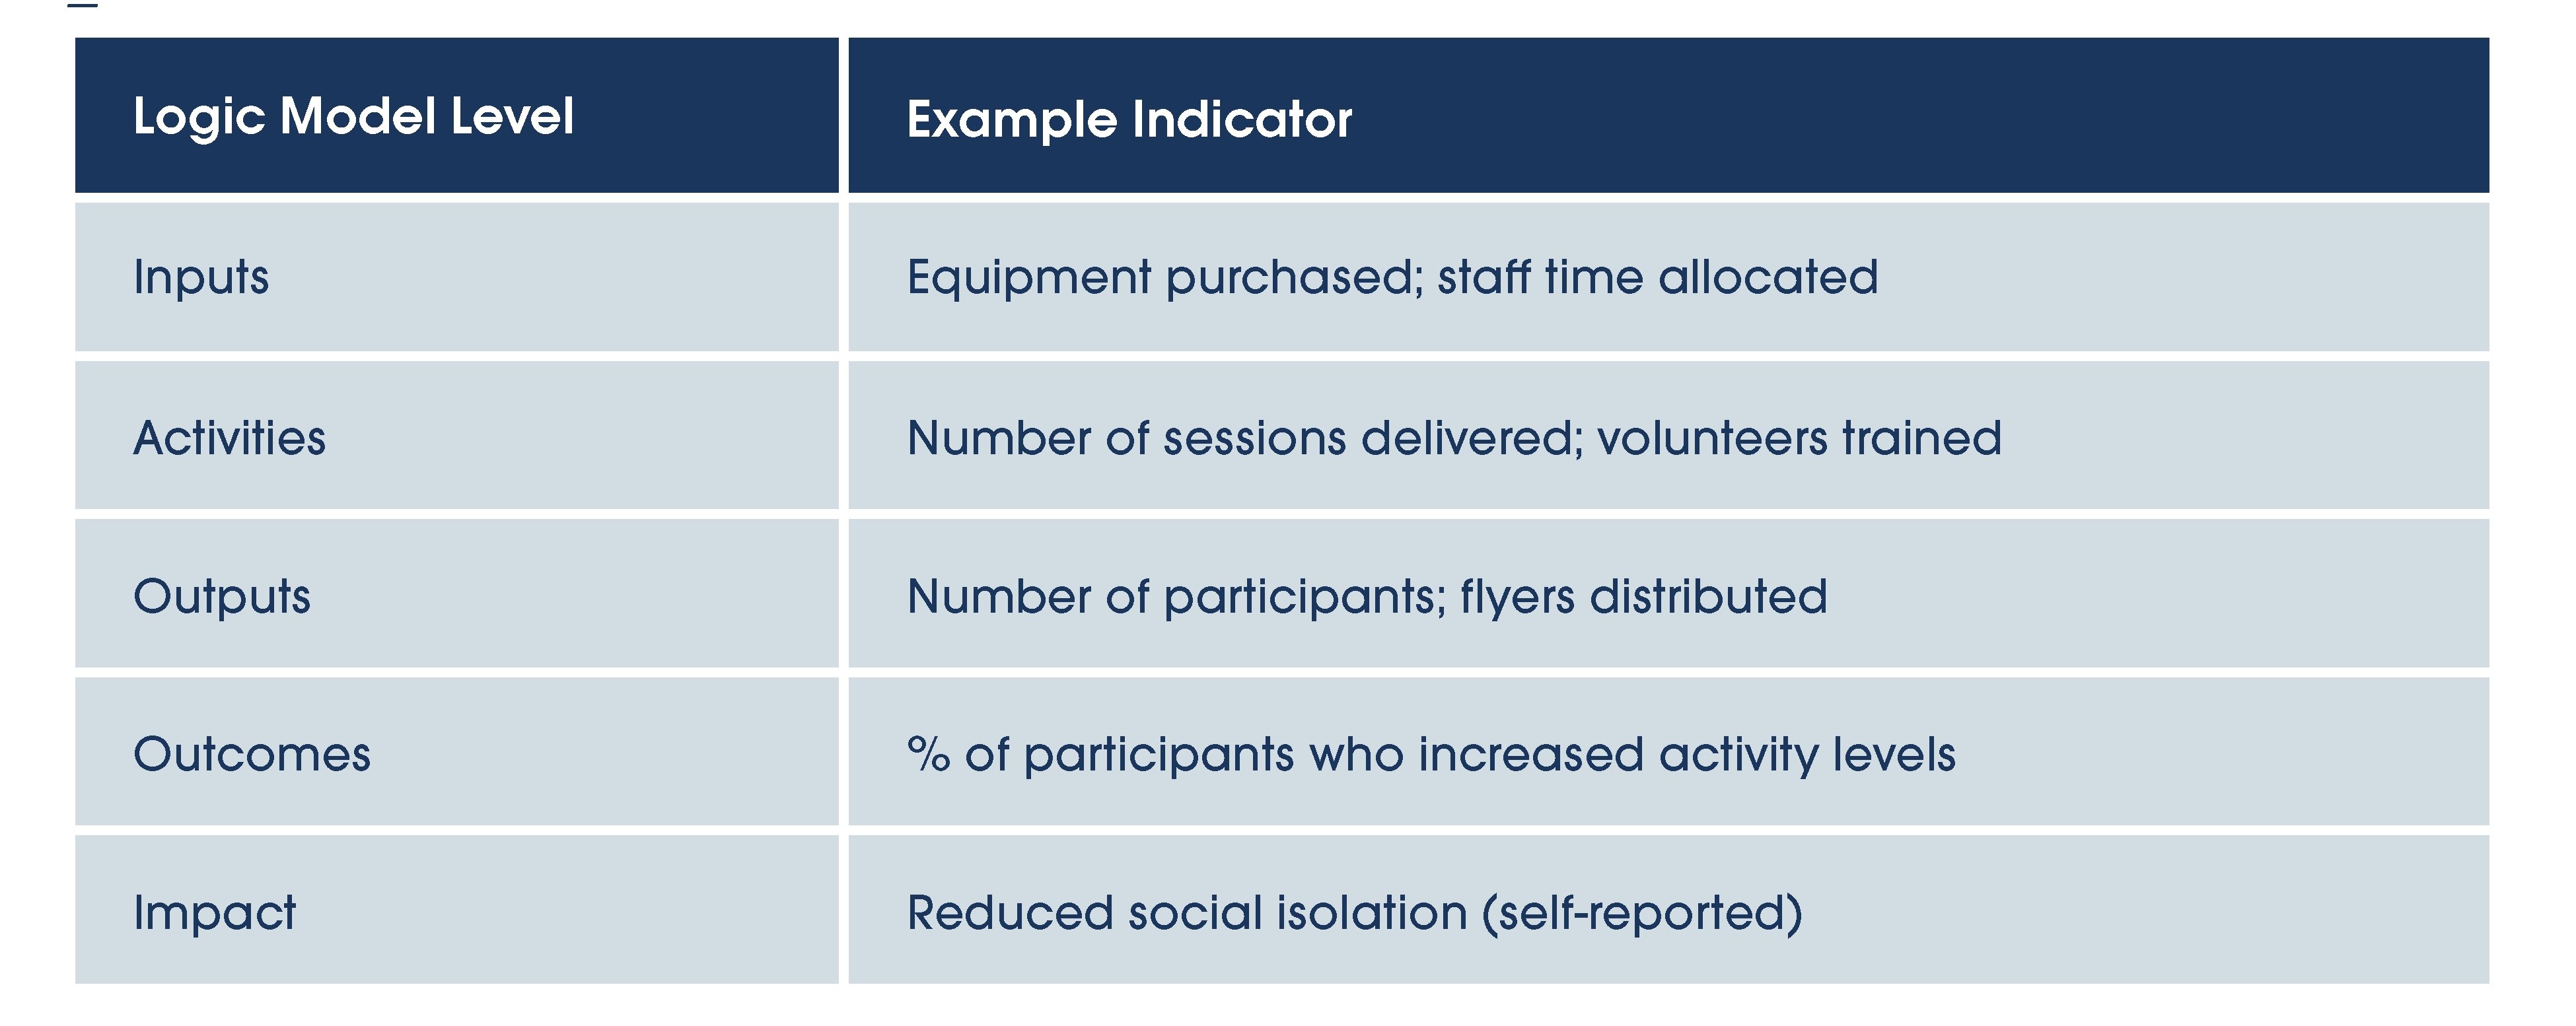
Your best indicators will tell the complete story of your project, from what you invested (inputs) to what you did (activities) to what happened (outputs, outcomes, and impact).
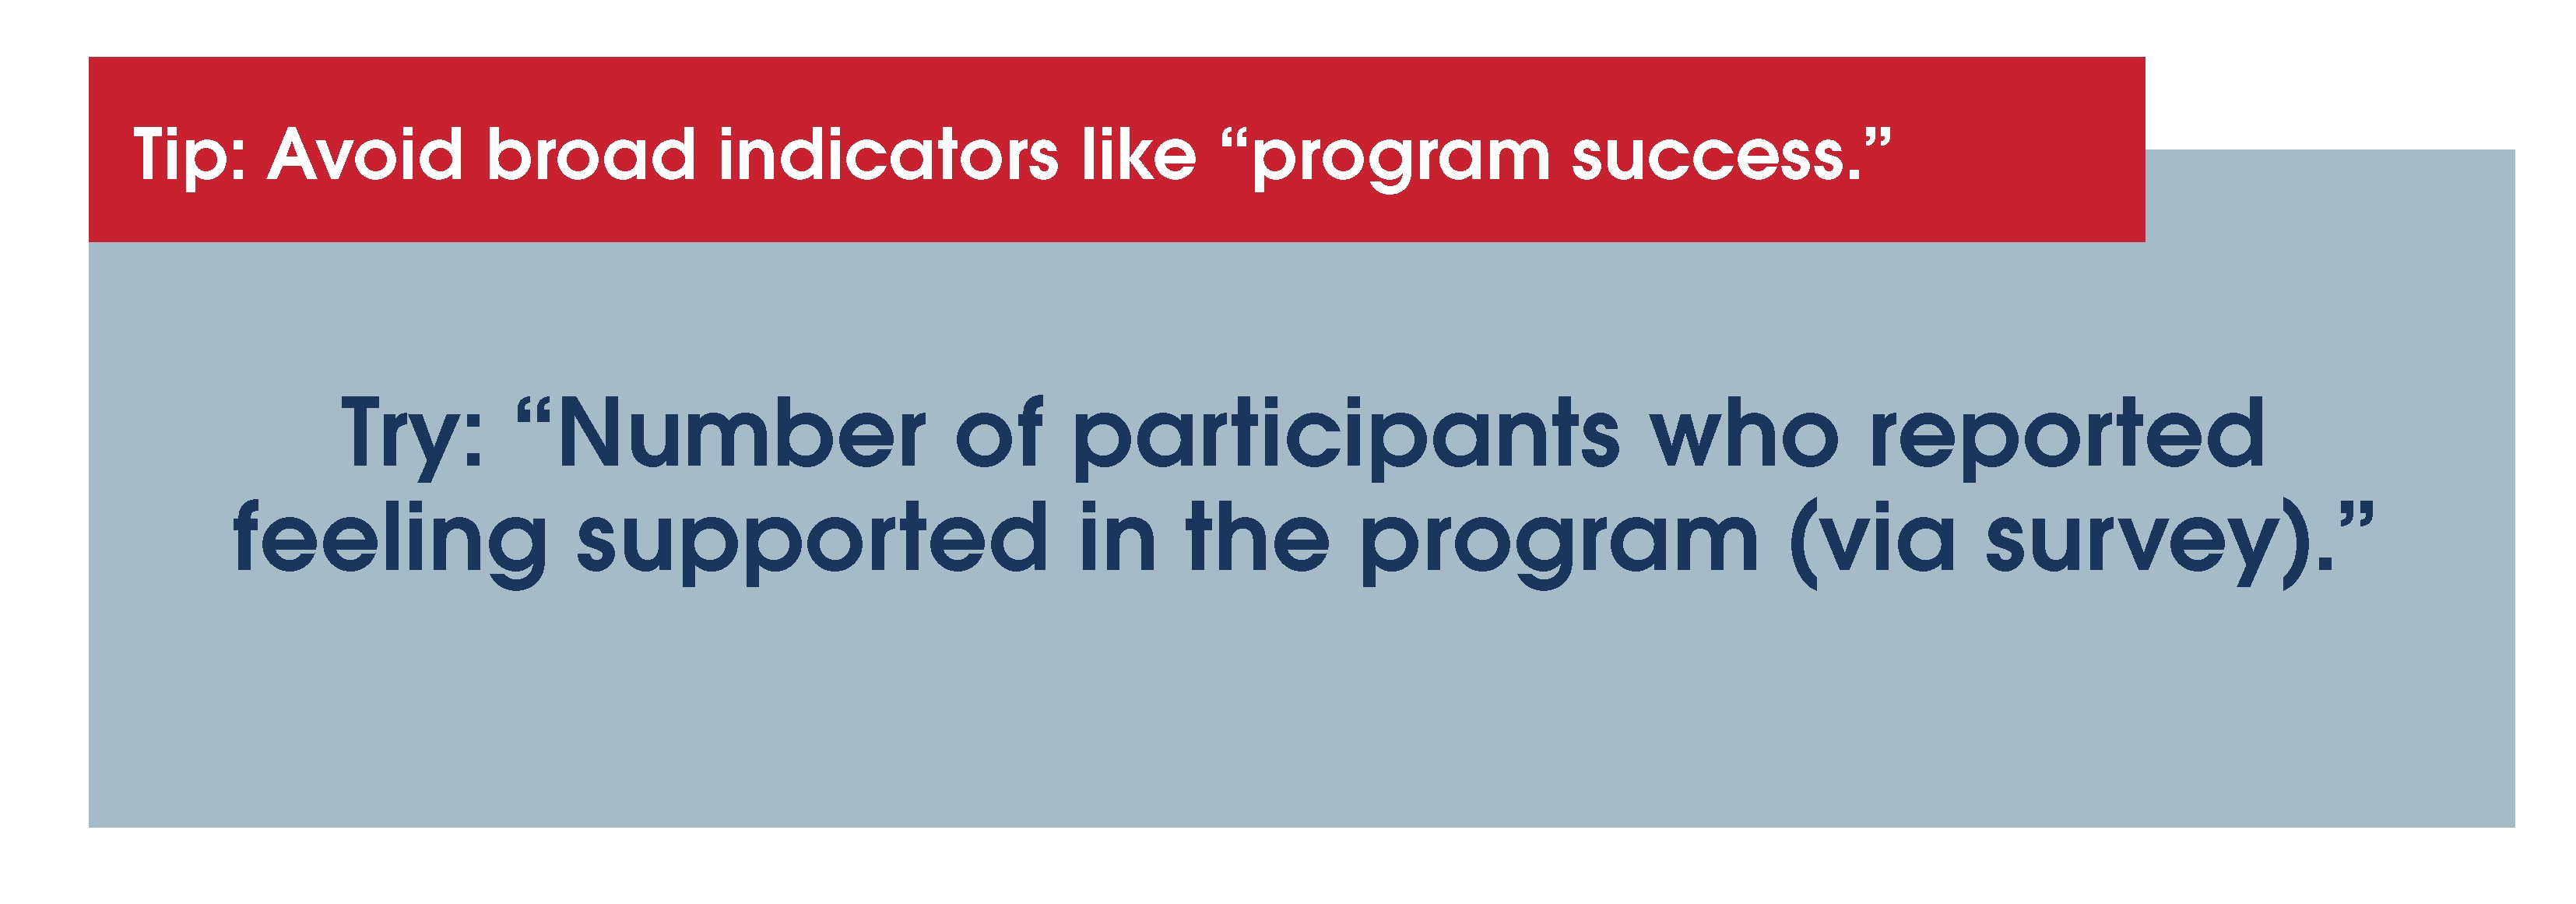
How to develop your own indicators
Creating your own indicators isn’t complicated, it’s about asking the right questions:
1. What’s your goal?
Are you trying to increase physical activity, reduce loneliness, boost confidence?
2. What would success look like?
What signs would show you’ve made progress? Think about behaviours, knowledge, attitudes, or experiences.
3. What can you measure?
Focus on what’s feasible. You don’t need to measure everything, just the most important things.
Heart Foundation requirements
All grantees must collect a few standard indicators. These are used to show who you reached, what you delivered, and what changed.
1. Biographical (Who participated?)
- Collected at registration:
- Gender
- Age
- Disability status
- Aboriginal and Torres Strait Islander identity
- Culturally and Linguistically Diverse (CALD) background
- Postcode
2. Outputs (What did you deliver?)
Track throughout your project:
- Number of unique participants
- Number of sessions or events held
- Number of volunteers (unique individuals)
- Number of volunteers trained – and what kind of training
- Number of partner organisations involved
3. Outcomes (What changed for participants?)
Collected at the start and end:
- % of participants who increased physical activity
- % who intend to stay active after the program
- % who say the program boosted their confidence
- Changes in mental health and wellbeing (Likert scales)
- Improvements in social connection and sense of community
Note: You are not required to measure impact. But the Heart Foundation requires certain minimum indicators. To help you tick off what you’re collecting and how:
Click to download the Table: Data Collection Methods (PDF)
Remember, good indicators are only useful if you collect the right information, and that starts with asking the right questions. We’ve included a table on how to phrase your questions to gather the data you need for your indicators in the link below:
Choosing data collection tools
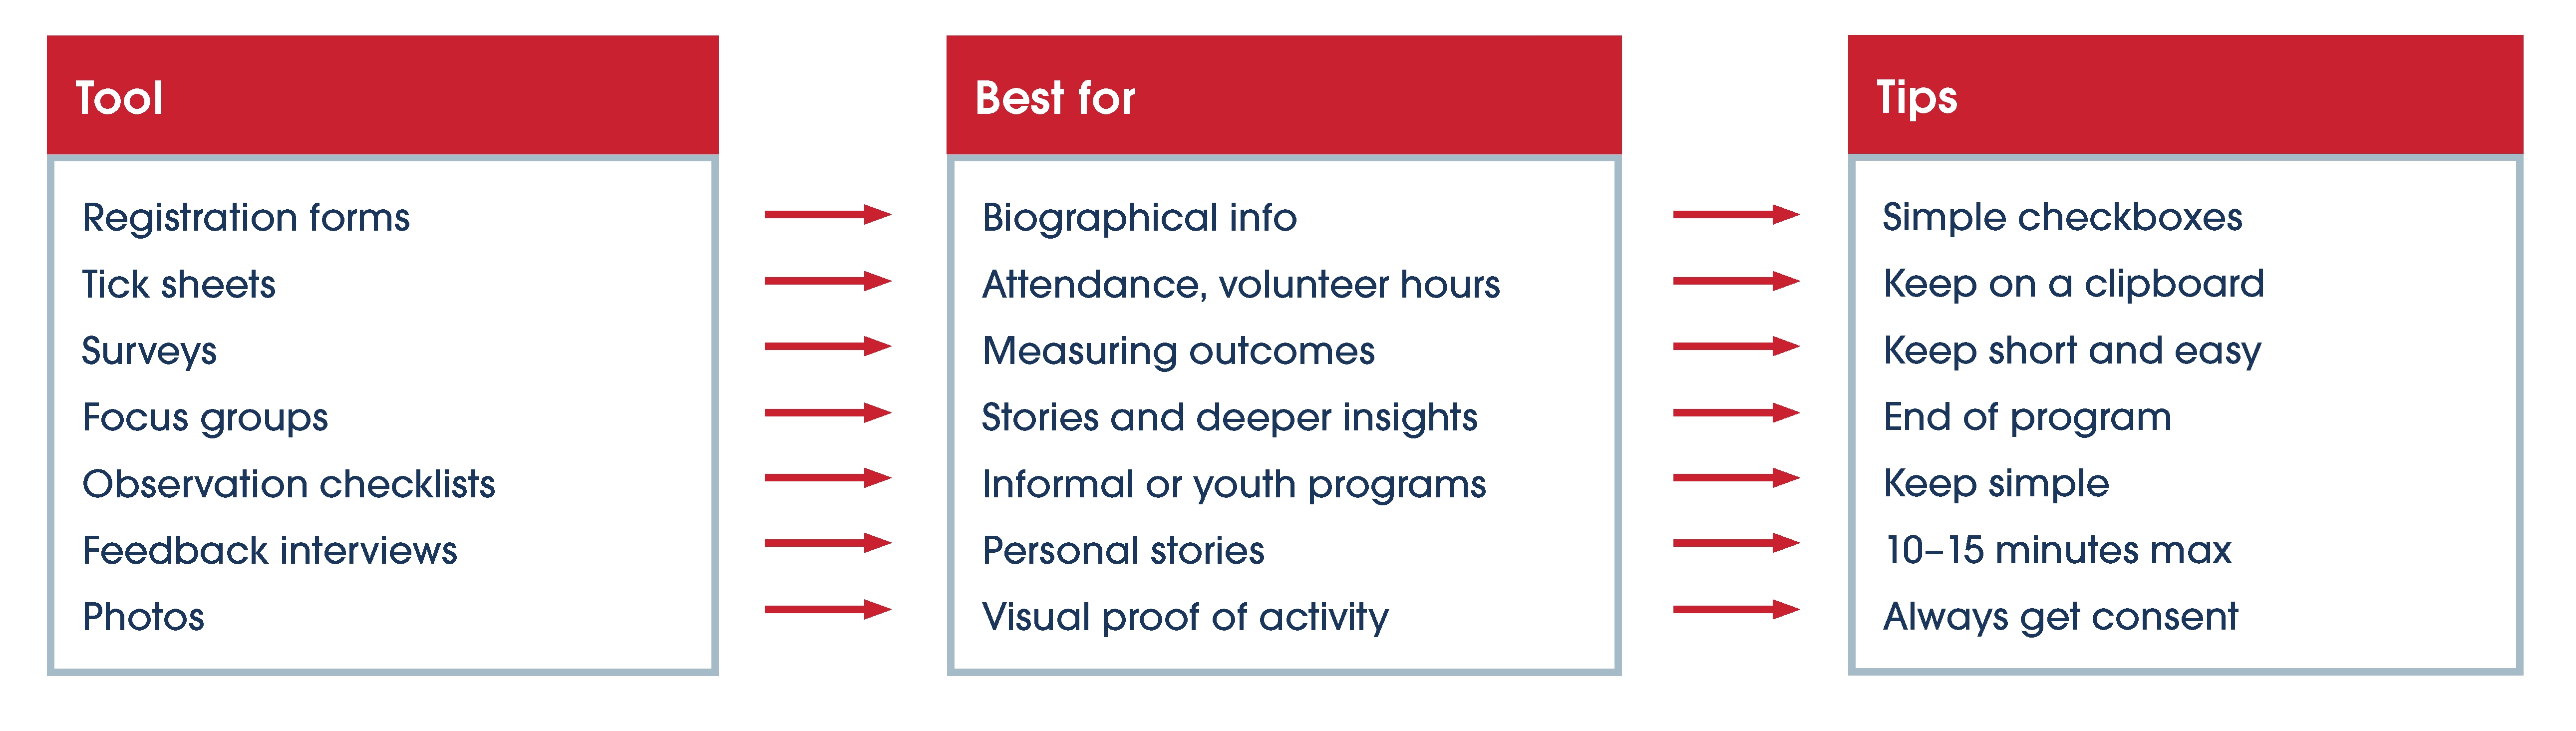
Once you’ve set your indicators, decide how to collect the data. Whether it’s registration forms, surveys, tick sheets, or photos; keep your tools simple and practical.
You don’t need fancy systems or special software. With a few simple tools and a clear plan, you can collect meaningful data that shows your impact and supports your reporting to the Heart Foundation. Below are some examples:
For additional ready-to-use resources and templates, explore the Australian Government Evaluation Toolkit. It includes ready-to-use resources tailored for community and government projects.
If unsure, contact us and we can help you choose what works best for your setting.
Making data collection simple
We don’t want M&E to be seen as something difficult and time-wasteful. To help with this, here are some golden rules for success:
- Be practical: Keep it manageable for your team or volunteers
- Right time, right data: Collect baseline (start) and outcome (end) data
- Use clear language: Avoid jargon, keep forms friendly
- Respect privacy: Tell participants why you’re collecting data and keep it safe
- Adjust as needed: Update your tools or indicators if your project changes
These golden rules can guide your approach, whether you’re collecting survey responses, tracking attendance, or having conversations with participants.
Now, let’s take a look at how indicators might work in practice.
Example: Active Together
Our example program is a fitness group for older adults, including those with chronic conditions.

Below is a table that captures the indicators, collection tools, frequency and timing to help measure the program.
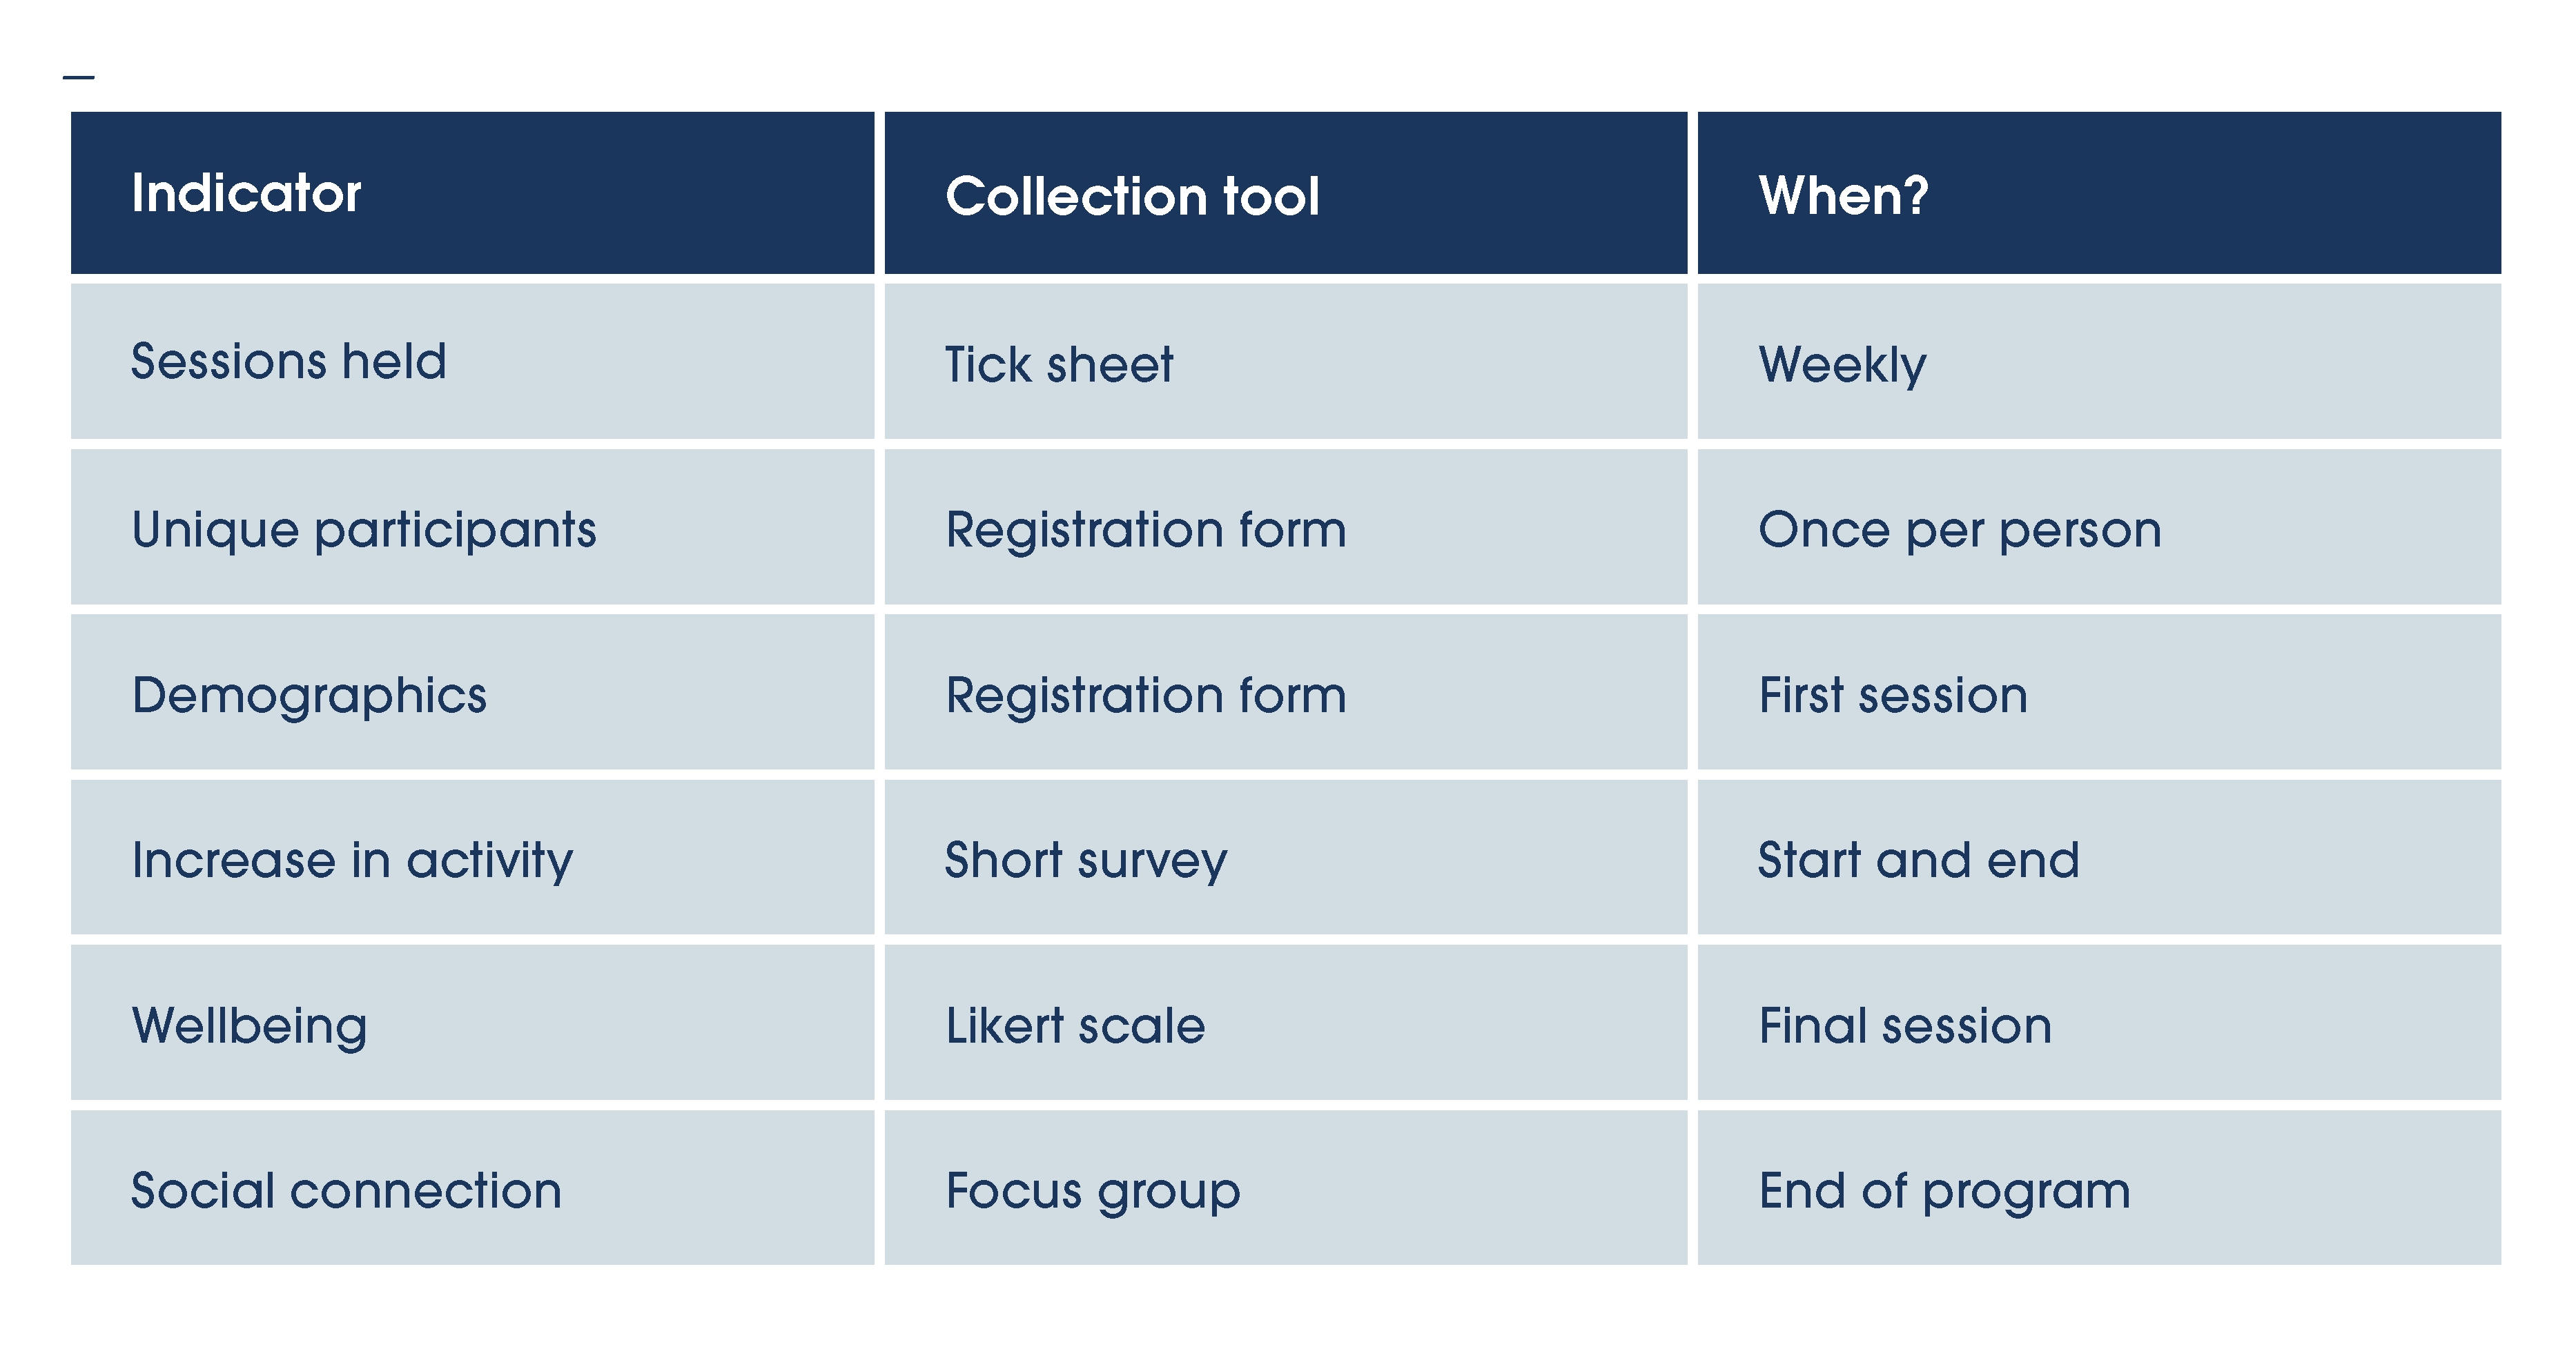
That’s all that is needed to map out the process for this program - simple, manageable, and effective.
What if my project changes?
Good question.
Projects evolve. You might add a new group, change locations, or shift your focus. That’s why your monitoring plan should be a living document that updates as your program adapts.
Update your plan when:
- You add or change activities
- You learn something new from your data
- Participants suggest improvements
- External circumstances change
Final thoughts and support
You know your community. You know what works. That makes you the best person to decide what data to collect and how to collect it. But we’re here to support you every step of the way.
Need help?
- Writing indicators?
- Adapting surveys?
- Choosing the right method?
Reach out to us. We’ve got tools, templates, and time to help. This is a partnership, not a test.
Now it’s your turn! Use this activity to start shaping your own monitoring and evaluation plan. Download the worksheet to identify indicators for your AAIC project, and make sure they’re aligned with what the Heart Foundation needs you to report.
Click to download the Identify the Indicators worksheet (PDF)

Optional: Want to better understand how to collect data in a practical and ethical way?
Check out this short article by INTRAC (2017):
References
- Australian Government. (n.d.). Evaluation toolkit: Templates, tools and resources. Department of the Treasury. https://evaluation.treasury.gov.au/toolkit/templates-tools-and-resources
- INTRAC. (2017). Principles of data collection. https://www.intrac.org/wpcms/wp-content/uploads/2017/01/Principles-of-data-collection.pdf