
Get the Blueprint
Blueprint 4th edition (PDF or Print) - Register your interest

Blueprint for an Active Australia
Action area 6: Active travel
Authors: Shannon Sahlqvist, Anna Timperio, Anthony Walsh, Stephen Hodge, Hayley Christian, Verity Cleland, Jenny Veitch, Venurs Loh, Kar Hau Chong.
Key messages
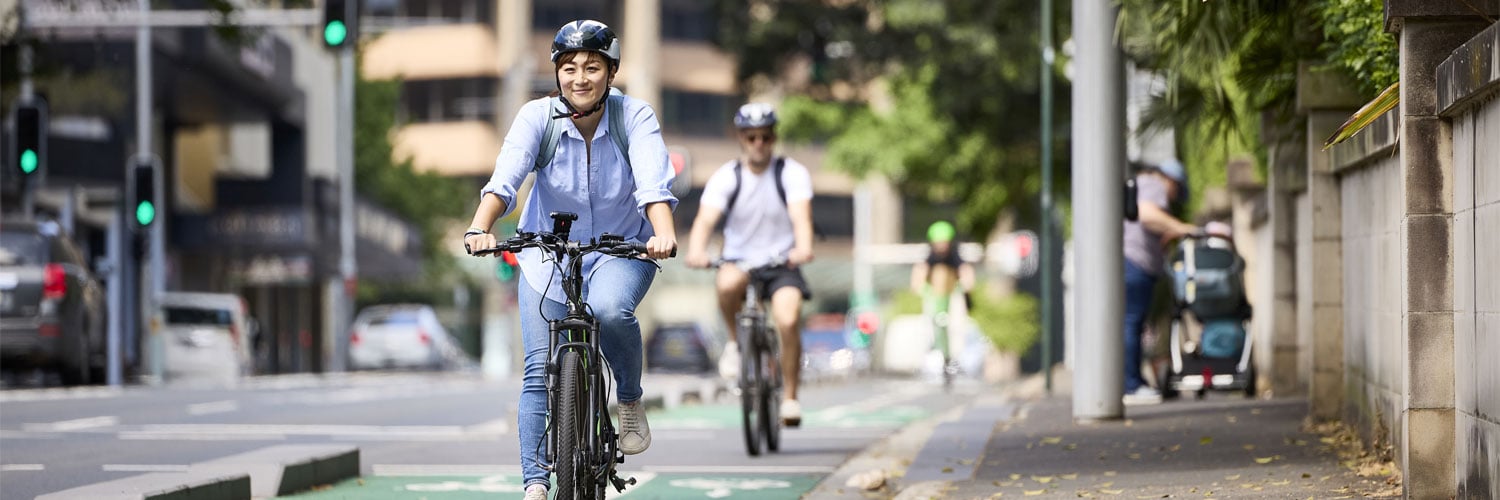
Australia is car-centric, with low rates of active travel. Substituting active for car travel can increase physical activity and reduce the risk of chronic diseases. It can also reduce traffic congestion and contribute to mitigating climate change. Reductions in public transport fares, re-allocation of road space to support bike riding, and traffic calming approaches have been trialled in Australia. More action is needed to truly support active travel and encourage behaviour change.
Strategic priorities
Key strategic priorities to support and improve active travel:
- Secure dedicated, increased funding for active travel. All levels of government should establish and safeguard a dedicated funding stream to expand and maintain infrastructure for walking, wheeling, and bike riding, and to support low-fare, high-frequency public transport.
- Deliver safe, convenient active travel infrastructure integrated with public transport. Create active travel-friendly communities that prioritise people over cars, including designing and delivering safe, comfortable and accessible active travel networks for all ages and abilities that seamlessly connect to public transport hubs and services.
Sustainable Development Goals
The United Nations Sustainable Development Goals1 that support active travel include:
For more information see Appendix 1.
Why is active travel important for physical activity?
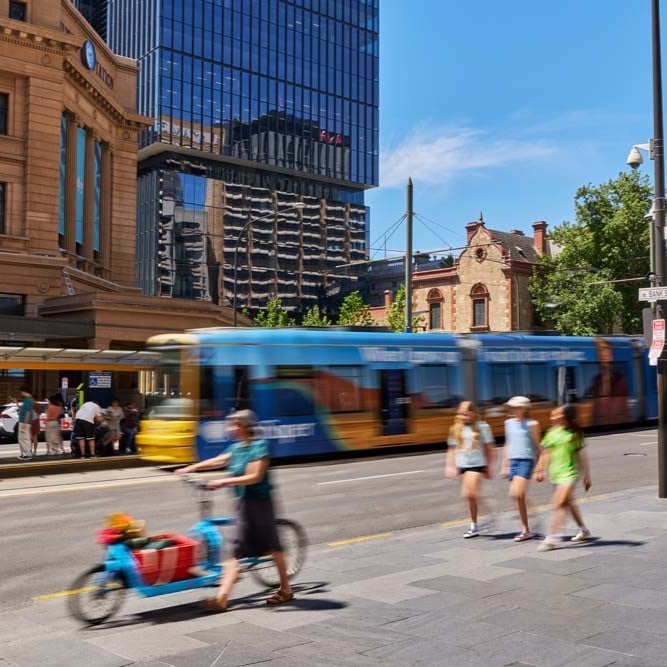
Australia has low rates of active travel, however, it presents a powerful opportunity to address multiple pressing issues – from rising rates of physical inactivity and chronic disease, to traffic congestion, climate change,2 and potentially cost of living pressures.
Consider the case for change:
- In Australia, car travel is the dominant mode of transport, with more than 70% of trips made by private vehicle.3-7 Limited public transport, long commute distances, and inadequate walking and bike riding infrastructure all contribute to car dependency.8
- In Australia, participation in active travel is low. Fewer than one third of school-aged children usually use an active mode of travel on the school journey,9 yet in some high income countries up to 80% of children engage in active school travel.10 Data from 2016 showed that only a small proportion of adults in Australia travelled to work using public transport (12%), walking (4%) or bike riding (1%).11 This is far fewer than those reported in many developed countries.12
- Enhancing active travel and public transport infrastructure creates safer, healthier, and more inclusive transport options, and helps to address the longstanding inequities in access experienced by the substantial number of people in Australia who are unable to drive due to age, disability, or other barriers. People living in urban fringe and growth areas are also disproportionately affected by poor access to public transport and supportive walking and bike riding environments, constraining their travel choices and increasing car dependence.13
- The health benefits of physical activity through active travel outweigh the risks of road-related injury and exposure to air pollution.14,15
- Children and adults who engage in active travel (including public transport) have higher levels of physical activity,16-20 and those who ride a bike for work or school journeys have higher fitness levels.17,21,22 Adults who travel by bike or rail have lower rates of cardiovascular disease than those who travel by private vehicle,22,23 and regular long duration car trips are associated with higher rates of obesity and cardiovascular problems.24-26
- Shifting to active travel improves air quality and may mitigate urban heat island effects by cutting emissions and heat from car exhaust.27,28
- Active travel benefits the economy by easing the social costs of traffic congestion,29 reducing public health costs, and stimulating local economies (as active travellers tend to shop more regularly).30,31
- There is growing support in Australia for governments to invest further in active travel. For example, almost two thirds of adults are in favour of reducing speed limits on local streets,32 52% support having more dedicated bike lanes separated from cars,33 and 76% support building more walking and cycling paths in their area.34 More than 80% of parents of primary school aged children surveyed in Victoria support measures like widening footpaths, adding more crossings around schools, and creating bike paths separated from car traffic to encourage active travel among children.35
What is working well to enable physical activity through active travel?
A variety of policies and initiatives are being used in Australia to encourage and support active travel. These include changes to public transport costs, the built environment and road speeds, and approaches to reduce parental concern for child active travel to school. The following points document what is working well.
- In recent years, initiatives aimed at reducing public transport fares have been implemented in Queensland and Tasmania. Among adults who took advantage of a trial of free bus fares in Tasmania, 46% reported using the bus more frequently, with their average weekly trips increasing from three to four.36
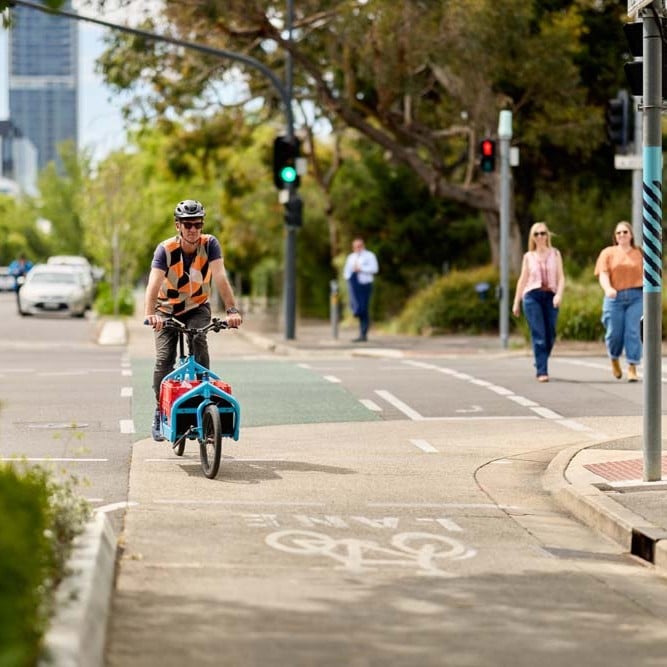
- During the early stages of the COVID-19 pandemic, the City of Melbourne and the Victorian Government, as well as other Australian councils and governments, reallocated road space to introduce barrier protected bike lanes across key inner-city routes (termed pop-up bike lanes). Bicycle counts in Melbourne increased in the separated lanes,37 and by April 2024 the City of Melbourne reported that over 27 km had been completed as permanent infrastructure. This contributed to a 22% increase in city centre bike riding. Importantly, one third of trips were made by women and girls for whom traffic safety is a particularly important consideration.38
- In Victoria, Bicycle Network and Merri-bek Council are collaborating with schools to trial the temporary closure of school streets to car traffic during drop-off and pick-up, called Open Streets. The program typically runs one day a week for three weeks, with schools helping to activate the streets by organising activities that encourage play. The 2023 report showed that on Open Streets days an average of 63% of children walked or rode a bike to school – an increase of about 19% over regular school days. Most parents (93%) reported the street felt safer and 97% indicated they wanted to see Open Streets at their school more often.39
- The Safe Active Streets Pilot Program was initiated by the Western Australian Department of Transport in 2015 and concluded in 2023. It aimed to create safer streets for walking and bike riding by implementing 30 km/h speed zones on local streets. These streets, or bike boulevards, incorporated various traffic calming measures including narrowed road widths, raised intersections, and landscaping to naturally slow down vehicle speeds.40 The program was developed in collaboration with local governments and tailored to meet specific community needs. Interim evaluations of the program indicated positive outcomes, including reductions in vehicle speeds and increased walking and bike riding.40
Case studies
The following case studies show how active travel can be supported in practice through safer streets, connected walking and bike riding networks, public transport initiatives, and school-based approaches that make it easier for people of all ages and abilities to choose active transport.
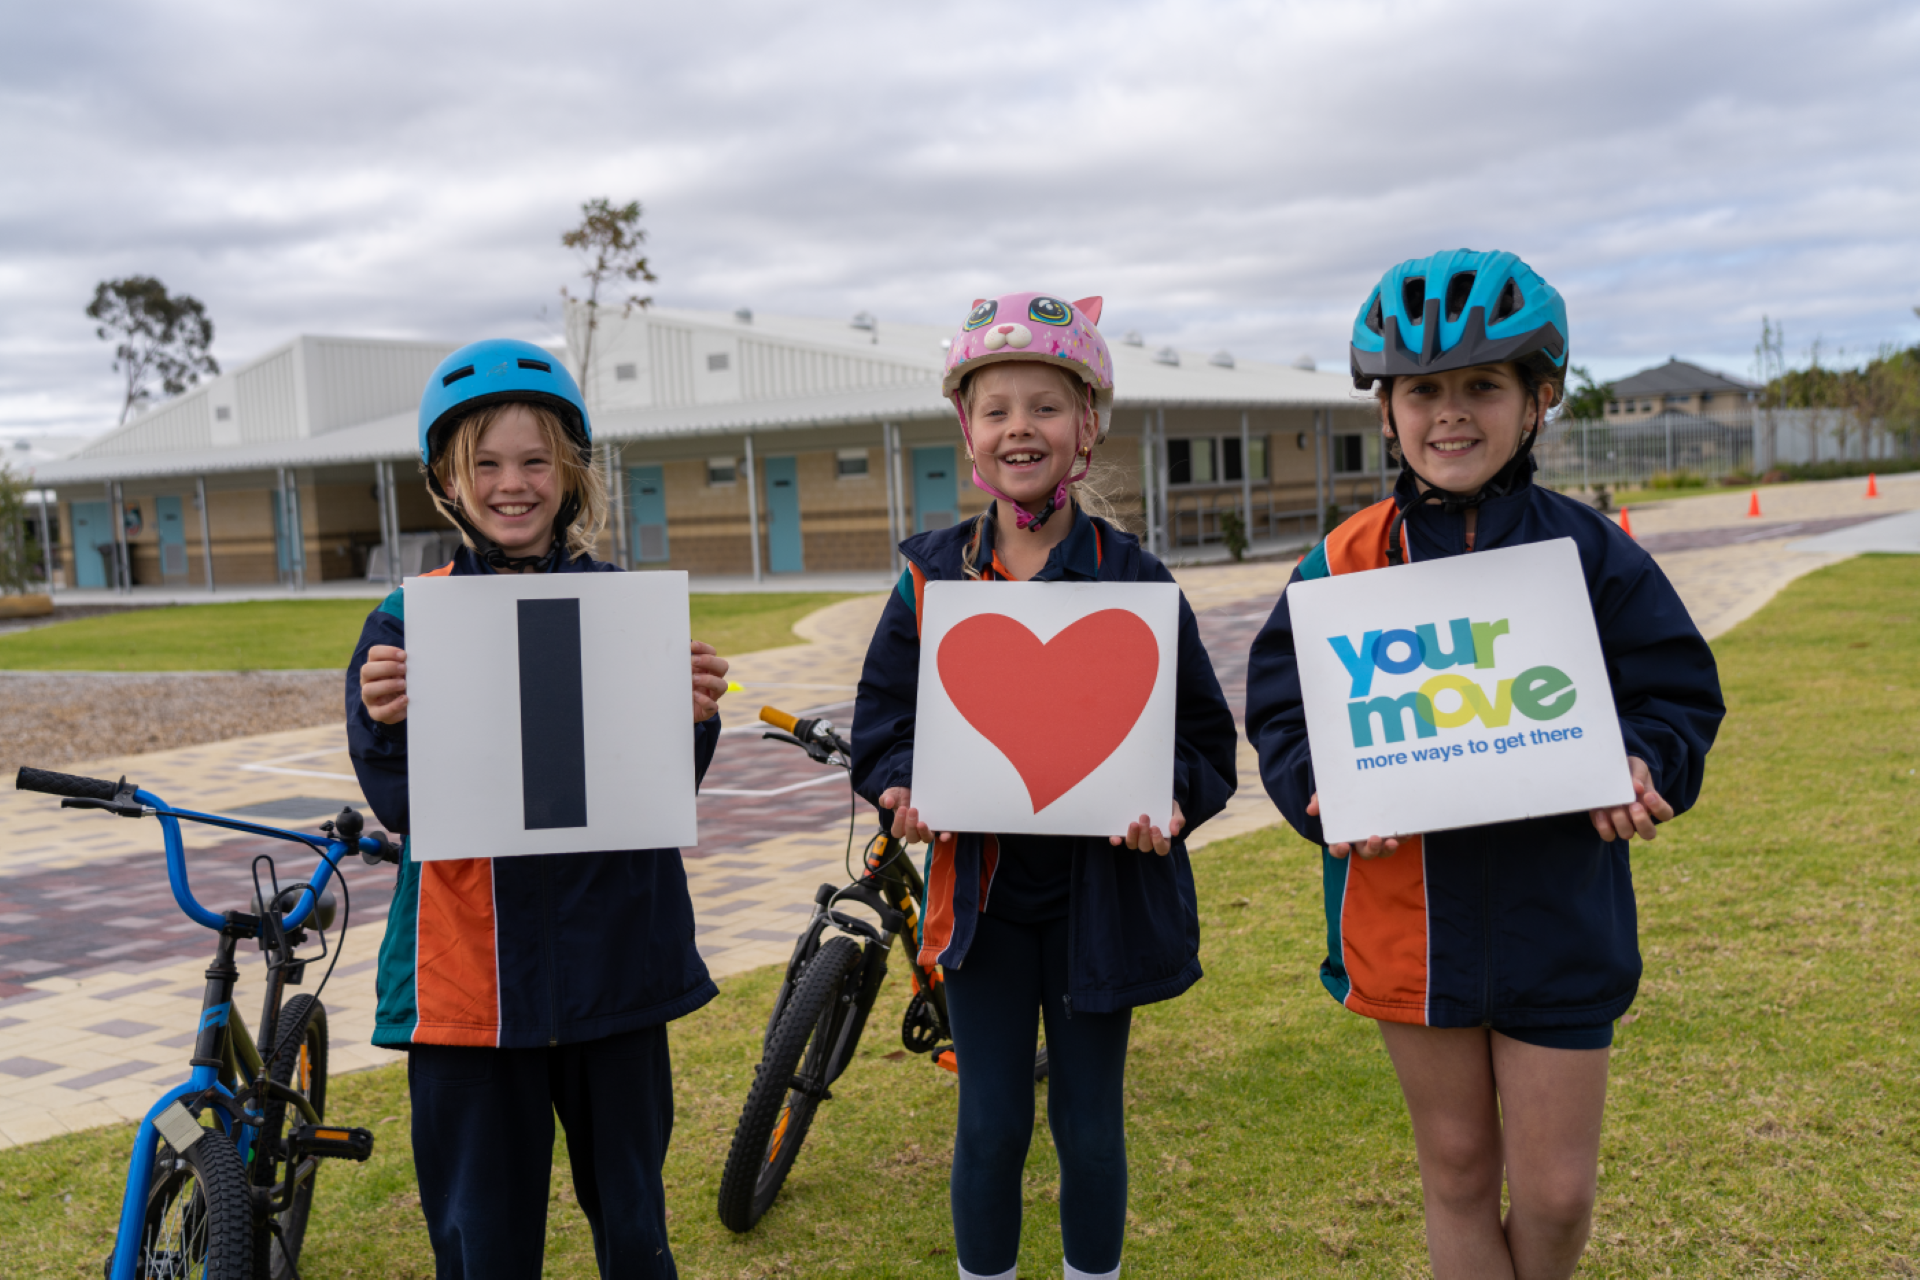
Your Move Schools: engaging schools to boost walking and riding
Your Move Schools is a free WA program that helps schools increase walking, wheeling and riding to school through incentives, grants, skills-building and safer connections.
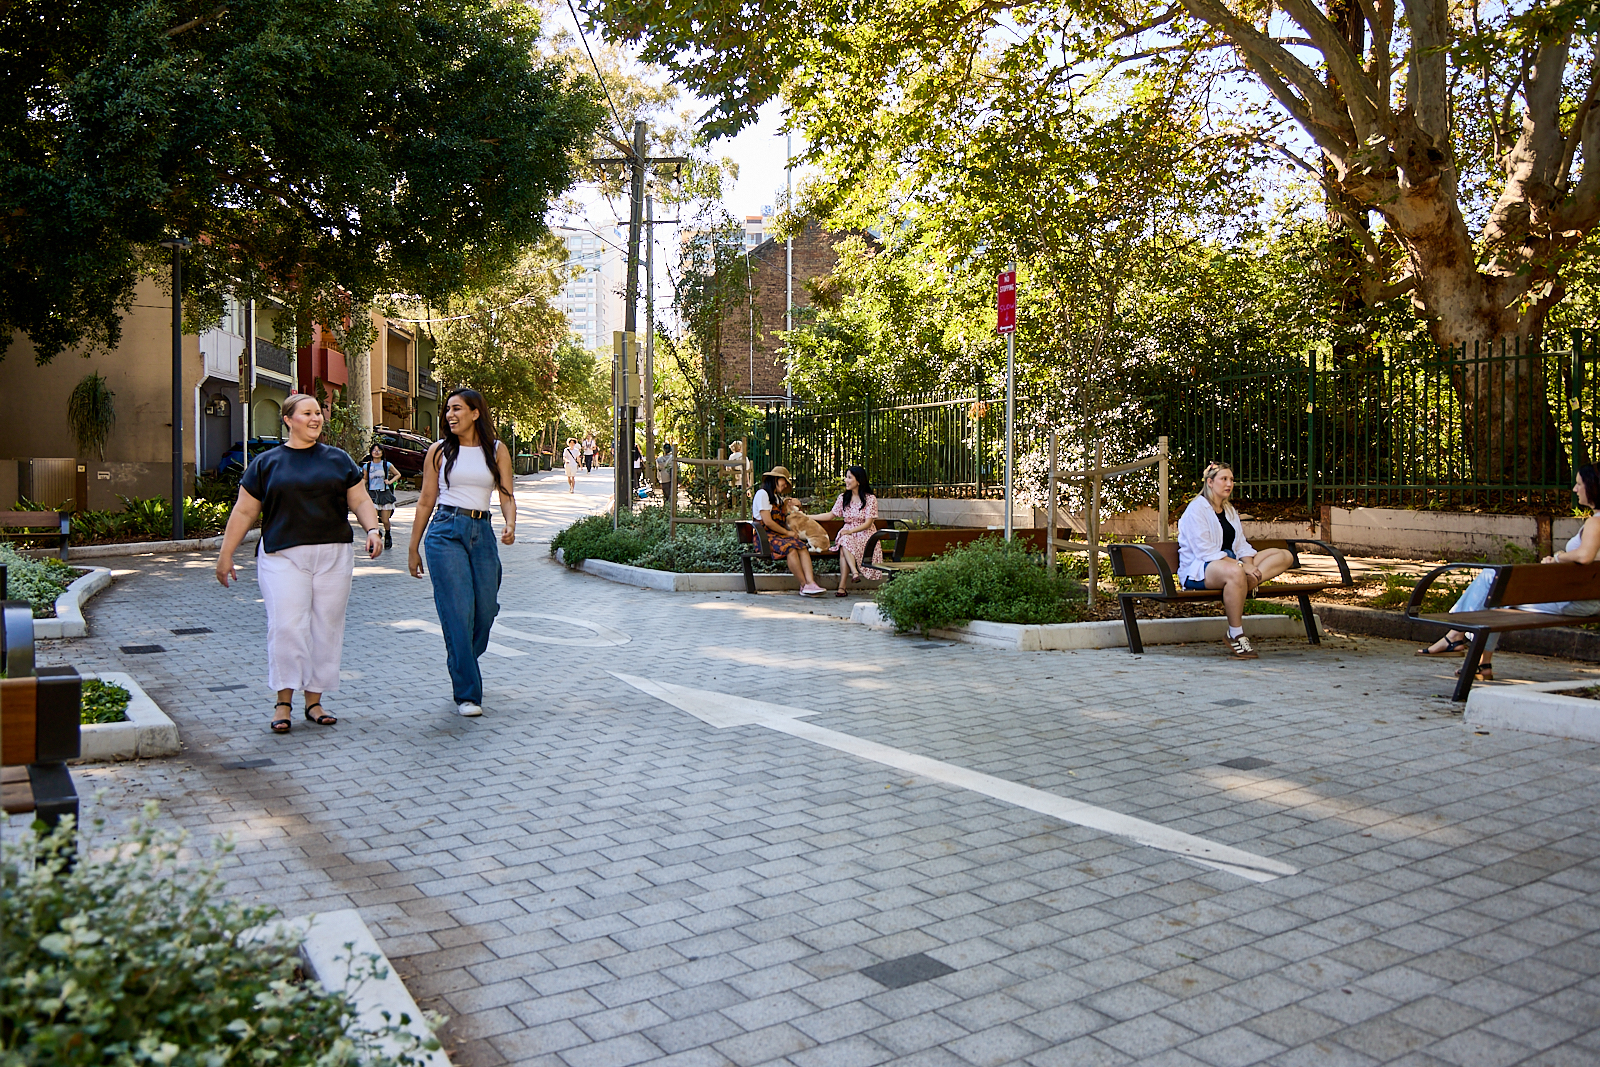
Heart Foundation’s interactive Community Walkability Map
A Heart Foundation digital mapping tool that inspires walking and advocates for more walkable neighbourhoods to support healthier, more active communities.
What must be done to increase physical activity through active travel?
The previous section highlighted some strategies that are working well to support active travel. However, more is needed to continue to support and improve participation in active travel, with a particular focus on making active travel safe and convenient. The recommendations below build on the evidence presented in this action area, including research on the health, environmental and economic benefits of active travel, the role of safe infrastructure and public transport, and evaluations of Australian initiatives such as fare reductions, school streets and safe active streets. Where published evidence is limited, recommendations reflect expert consensus.
Policy, practice and leadership
- All levels of government should support greater investment in initiatives to increase active travel and use of public transport for all. Land use and transport policies should be integrated and aligned to enable more people to walk, wheel, bike ride and use public transport as part of their daily lives.41
- Enable greater use of public transport through provision of low-cost fares, subsidies and services with optimal frequency and operating hours in metro and regional areas. In a Tasmanian trial of free bus fares, almost half of participants used the bus more often.36
- Introduce incentives to encourage a switch to active travel from car travel. These could include a commuter allowance for people who ride a bike to work42 (e.g. a payment per kilometre ridden, funded by employers or through tax concessions). Car use could be discouraged in congested areas by introducing congestion charges and increasing costs and/or decreasing availability of parking.42-45 The revenue raised could then be invested in public and active transport initiatives.
- Implement social marketing and culture change initiatives that normalise active travel and public transport.46 Social marketing should emphasise the many benefits of active travel including improved health, lower travel costs, reduced urban congestion, and climate change mitigation.
Urban design and planning
- Prioritise people-first approaches to street design. These include greater adoption of frameworks such as Movement and place,47 as well as design principles advocated by the Heart Foundation’s flagship program, Healthy Active by Design.48 Strategies include:
- reducing posted speed limits to 30 km/h around schools, shops and other high pedestrian areas
- implementing physical traffic calming treatments or modal filtering
- adopting area-wide approaches such as low traffic neighbourhoods49,50 or superblocks.51,52
- Design urban environments to make walking, wheeling, bike riding and public transport use safe, convenient and comfortable.53 Strategies include:
- reclaiming road space for bike riding and public transport, with dedicated bike and bus lanes and separation of bike lanes from vehicular traffic on busy roads and, on quiet streets, low-speed mixed traffic environments
- placing safe road crossings at logical crossing points leading to key destinations including public transport stops
- providing no cost, safe, secure and well-located facilities for bicycle parking
- creating attractive, well-lit streetscapes with shade trees and quality public amenities, including accessible toilet facilities and seating for rest stops
- trialling pop-up style approaches to provide the community and stakeholders with the ability to experience change before being fully implemented. Melbourne's pop-up bike lanes increased bike riding and became over 27 km of permanent infrastructure.37,38
- Promote active school travel through application of the safe routes to school framework. This involves enhancing walking, wheeling and bike riding infrastructure to the school gate, including the implementation of education programs and engagement with communities and local governments. Specific examples include designated car drop off zones situated up to 500 m from school linked by safe walking routes, and bike and scooter education programs. For further information see the Heart Foundation’s Healthy Active by Design Active school travel evidence paper.54
Research, data and innovation
- A review of the evidence for this action area identified the following priorities for investment in research, data and innovation.
- Rigorously design real-world evaluations to assess the multifaceted impacts of active travel infrastructure and policy interventions. It is critical that these evaluations are conducted in partnership with practitioners, policy makers and researchers, and that they examine differential impacts across population subgroups, the specific behavioural outcomes influenced, and the underlying mechanisms driving any change. These evaluations should also encompass the broader economic, social, and environmental consequences of the interventions to fully inform future investment and policy decisions.
- Improve data collection methods to better understand who is, or is not, using active travel and why. Regular surveillance is required to capture shifts in travel mode.
- Develop national guidelines to standardise geographical information system (GIS) data collection methods across Australia. Enhanced geospatial data, modelling and platforms would allow better planning and evaluation of active travel infrastructure.
- Conduct research to understand community, business and political resistance to active travel infrastructure and policy changes to shift public and political narratives and strengthen community buy‑in.
References
1. United Nations. Sustainable Development Goals. Accessed 6 July 2026. https://sdgs.un.org/goals
2. Ding D, Luo M, Infante MFP, et al. The co-benefits of active travel interventions beyond physical activity: a systematic review. Lancet Planet Health. 2024;8(10):e790–e803. doi:10.1016/S2542-5196(24)00201-8
3. State Government of Victoria, Department of Transport. Victorian Integrated Survey of Travel & Activity (VISTA): trips - method of travel, Greater Melbourne. 2026. Accessed 31 July 2026. https://public.tableau.com/app/profile/vista/viz/VISTA-Trips/Trips-methodoftravel
4. NSW Government, Transport for NSW. Data by region (Post-COVID (2020 Onwards)), trip characteristics, mode share, Sydney GCCSA 2024/2025. 2026. Accessed 31 July 2026. https://www.transport.nsw.gov.au/data-by-region
5. Tasmanian Government, State Roads, Department of State Growth. Greater Hobart Household Travel Survey: Overview of Travel Behaviour – 2019 to 2023. 2025. https://www.transport.tas.gov.au/__data/assets/pdf_file/0004/587560/Greater-Hobart-Household-Travel-Survey-Summary-report-v1.0.pdf [PDF]
6. Sift Research. ACT & Queanbeyan Household Travel Survey 2022: Travel overview. 2023. https://www.transport.act.gov.au/planning-for-the-future/household-travel-survey
7. Queensland Government, Department of Transport and Main Roads. Queensland household travel survey interactive report: how South East Queensland travels, 2018. 2019. https://www.tmr.qld.gov.au/community-and-environment/research-and-education/queensland-travel-survey
8. Currie G, Richardson T, Smyth P, et al. Investigating links between transport disadvantage, social exclusion and well-being in Melbourne – updated results. Res Transp Econ. 2010;29(1):287–295. doi:10.1016/j.retrec.2010.07.036
9. Hesketh KD, Booth V, Cleland V, et al. Results from the Australian 2022 Report Card on physical activity for children and young people. J Exerc Sci Fit. 2023;21(1):83–87. doi:10.1016/j.jesf.2022.10.006
10. Aubert S, Barnes JD, Abdeta C, et al. Global Matrix 3.0 Physical Activity report card grades for children and youth: results and analysis from 49 countries. J Phys Act Health. 2018;15(s2):S251–S273. doi:10.1123/jpah.2018-0472
11. Australian Bureau of Statistics. Australia’s journey to work. 2022. Accessed 23 February 2026. https://www.abs.gov.au/articles/australias-journey-work
12. Fishman E, Naseri M, Davies L, Tran J, Katsu T. Prioritising Active Transport. 2024. https://austroads.gov.au/publications/active-travel/ap-r711-24
13. Sugiyama T, Hadgraft N, Abe T, Petrunoff N, Owen N, Chandrabose M. Neighbourhood socioeconomic disparities in active travel and car dependency in Australian urban settings. Cities. 2025;160:105845. doi:10.1016/j.cities.2025.105845
14. Mueller N, Rojas-Rueda D, Cole-Hunter T, et al. Health impact assessment of active transportation: a systematic review. Prev Med. 2015;76:103–114. doi:10.1016/j.ypmed.2015.04.010
15. Xia T, Nitschke M, Zhang Y, Shah P, Crabb S, Hansen A. Traffic-related air pollution and health co-benefits of alternative transport in Adelaide, South Australia. Environ Int. 2015;74:281–290. doi:10.1016/j.envint.2014.10.004
16. Schoeppe S, Duncan MJ, Badland H, Oliver M, Curtis C. Associations of children’s independent mobility and active travel with physical activity, sedentary behaviour and weight status: a systematic review. J Sci Med Sport. 2013;16(4):312–319. doi:10.1016/j.jsams.2012.11.001
17. Larouche R, Saunders TJ, Faulkner GEJ, Colley R, Tremblay M. Associations between active school transport and physical activity, body composition, and cardiovascular fitness: a systematic review of 68 studies. J Phys Act Health. 2014;11(1):206–227. doi:10.1123/jpah.2011-0345
18. Sahlqvist S, Goodman A, Cooper AR, Ogilvie D. Change in active travel and changes in recreational and total physical activity in adults: longitudinal findings from the iConnect study. Int J Behav Nutr Phys Act. 2013;10(1):28. doi:10.1186/1479-5868-10-28
19. Wener RE, Evans GW. A morning stroll: levels of physical activity in car and mass transit commuting. Environ Behav. 2007;39(1):62–74. doi:10.1177/0013916506295571
20. Rissel C, Curac N, Greenaway M, Bauman A. Physical activity associated with public transport use - a review and modelling of potential benefits. Int J Environ Res Public Health. 2012;9(7):2454–2478. doi: 10.3390/ijerph9072454
21. Lubans DR, Boreham CA, Kelly P, Foster CE. The relationship between active travel to school and health-related fitness in children and adolescents: a systematic review. Int J Behav Nutr Phys Act. 2011;8:5. doi:10.1186/1479-5868-8-5
22. Grøntved A, Rasmussen MG, Blond K, Østergaard L, Andersen ZJ, Møller NC. Bicycling for transportation and recreation in cardiovascular disease prevention. Curr Cardiovasc Risk Rep. 2019;13:26. doi:10.1007/s12170-019-0623-z
23. Patterson R, Panter J, Vamos EP, Cummins S, Millett C, Laverty AA. Associations between commute mode and cardiovascular disease, cancer, and all-cause mortality, and cancer incidence, using linked Census data over 25 years in England and Wales: a cohort study. Lancet Planet Health. 2020;4(5):e186–e194. doi:10.1016/S2542-5196(20)30079-6
24. Sugiyama T, Chandrabose M, Homer AR, Sugiyama M, Dunstan DW, Owen N. Car use and cardiovascular disease risk: systematic review and implications for transport research. J Transp Health. 2020;19:100930. doi:10.1016/j.jth.2020.100930
25. Sugiyama T, Wijndaele K, Koohsari MJ, Tanamas SK, Dunstan DW, Owen N. Adverse associations of car time with markers of cardio-metabolic risk. Prev Med. 2016;83:26–30. doi:10.1016/j.ypmed.2015.11.029
26. Warren TY, Barry V, Hooker SP, Sui X, Church TS, Blair SN. Sedentary behaviors increase risk of cardiovascular disease mortality in men. Med Sci Sports Exerc. 2010;42(5):879–885. doi:10.1249/MSS.0b013e3181c3aa7e
27. Brand C, Götschi T, Dons E, et al. The climate change mitigation impacts of active travel: evidence from a longitudinal panel study in seven European cities. Glob Environ Change. 2021;67:102224. doi:10.1016/j.gloenvcha.2021.102224
28. Piracha A, Chaudhary MT. Urban air pollution, urban heat island and human health: a review of the literature. Sustainability. 2022;14(15):9234. doi:10.3390/su14159234
29. Australian Government, The Department of Infrastructure, Transport and Regional Development, Bureau of Infrastructure, Transport and Regional Economics. Traffic and congestion cost trends for Australian capital cities. Information Sheet 74. 2015. https://www.bitre.gov.au/publications/2015/is_074
30. Clifton K, Muhs C, Morrissey S, Morrissey T, Curran K, Ritter C. Examining consumer behaviour and travel choices. 2013. https://rosap.ntl.bts.gov/view/dot/25659
31. Popovich N, Handy SL. Bicyclists as consumers: mode choice and spending behavior in downtown Davis, California. Transp Res Rec. 2014;2468(1):47–54. doi:10.3141/2468-06
32. National Heart Foundation of Australia. What Australia wants: neighbourhood design. 2025. https://irp.cdn-website.com/541aa469/files/uploaded/What_Australia_Wants_-_National_Heart_Foundation_FINAL.pdf [PDF]
33. Arndt D, Dickson E, MMResearch, YouGov. Send the right signal: how to effectively talk about sustainable transport. 2020. https://www.climatecouncil.org.au/wp-content/uploads/2022/10/CC_MVSA0316-CC-Sustainable-Transport-Communications-Guide_V6-FA.pdf [PDF]
34. Harrington M. On your bike. Policies to increase rates of active transport. 2024. Accessed 23 February 2026. https://australiainstitute.org.au/post/on-your-bike-policies-to-increase-rates-of-active-transport/
35. Sahlqvist S, Lim K, Loh V, Veitch J, Salmon J, Timperio A. Understanding parental support for infrastructure and policy changes that encourage active travel among children. J Transp Health. 2024;39:101932. doi:10.1016/j.jth.2024.101932
36. Sharman MJ, Stanesby O, Jose KA, Greaves S, Cleland V. Free bus fares, bus use and physical activity: an exploratory cross-sectional study. Health Promot J Austr. 2024;36(1):e881. doi:10.1002/hpja.881
37. Delbosc A, Goh ZS, Naseri M, Powers T. Can curbside bicycle lanes buffer COVID-19 ridership losses? A case study from Melbourne, Australia. Transp Res Part A Policy Pract. 2025;195:104438. doi:10.1016/j.tra.2025.104438
38. City of Melbourne. New bike lanes. 2025. Accessed 29 October 2025. https://www.melbourne.vic.gov.au/new-bike-lanes
39. Bicycle Network and Merri-bek City Council. Open Streets Trials 2023. 2023. https://zerocarbonmerri-bek.org.au/ride-and-stride/
40. Government of Western Australia, Department of Transport and Major Infrastructure. Safe Active Streets pilot program. 2025. https://transport.wa.gov.au/active-transport/programs-initiatives/safe-active-streets-pilot-program
41. Winters M, Buehler R, Götschi T. Policies to promote active travel: evidence from reviews of the literature. Curr Environ Health Rep. 2017;4(3):278–285. doi:10.1007/s40572-017-0148-x
42. Martin A, Suhrcke M, Ogilvie D. Financial incentives to promote active travel: an evidence review and economic framework. Am J Prev Med. 2012;43(6):e45–e57. doi:10.1016/j.amepre.2012.09.001
43. Adhikari A, Ryan M, Harrington M. Proactive investment: policies to increase rates of active transportation. 2024. https://cdn.australiainstitute.org.au/2024/10/17231417/P1682-Policies-to-increase-rates-of-active-transportation-Web.pdf [PDF]
44. European Commission, EU Urban Mobility Observatory. A cycling kilometric allowance in France. 2017. Accessed 16 October 2026. https://urban-mobility-observatory.transport.ec.europa.eu/resources/case-studies/cycling-kilometric-allowance-france_en
45. Máca V, Ščasný M, Zvěřinová I, Jakob M, Hrnčíř J. Incentivizing commuter cycling by financial and non-financial rewards. Int J Environ Res Public Health. 2020;17(17):6033. doi:10.3390/ijerph17176033
46. Ma L, Mulley C, Liu W. Social marketing and the built environment: what matters for travel behaviour change? Transportation. 2017;44(5):1147–1167. doi:10.1007/s11116-016-9698-2
47. NSW Government. Movement and place. 2025. Accessed 29 October 2025. https://www.movementandplace.nsw.gov.au/about
48. National Heart Foundation of Australia. Healthy active by design. 2026. Accessed 24 February 2026. https://www.healthyactivebydesign.com.au/
49. Xiao CS, Sinclair N, Saunders L, Panter J. Evaluating the impact of low traffic neighbourhoods in areas with low car ownership: a natural experimental evaluation. J Transp Health. 2023;33:101658. doi:10.1016/j.jth.2023.101658
50. Timperio A, Lee A, Gunn L, et al. The Heart of Road Use: Evidence Review prepared for the National Heart Foundation of Australia. 2025. https://irp.cdn-website.com/541aa469/files/uploaded/Heart+of+Road+Use+Evidence+paper+FINAL.pdf [PDF]
51. Mueller N, Rojas-Rueda D, Khreis H, et al. Changing the urban design of cities for health: the superblock model. Environ Int. 2020;134:105132. doi:10.1016/j.envint.2019.105132
52. Nieuwenhuijsen M, de Nazelle A, Pradas MC, et al. The Superblock model: a review of an innovative urban model for sustainability, liveability, health and well-being. Environ Res. 2024;251:118550. doi:10.1016/j.envres.2024.118550
53. Panter J, Guell C, Humphreys D, Ogilvie D. Can changing the physical environment promote walking and cycling? A systematic review of what works and how. Health Place. 2019;58:102161. doi:10.1016/j.healthplace.2019.102161
54. Sahlqvist S, Timperio A, Cleland V, et al. Active school travel. 2025. https://www.healthyactivebydesign.com.au/habd-news/active-school-travel-july-2025
Heart Foundation related information for active travel

Built environments
Sport and active recreation